Prices for homes purchased in the Tucson Metropolitan Statistical Area (MSA) increased by 6.8% between the fourth quarter of 2015 and the fourth quarter of 2016, according to the Federal Housing Finance Agency. Tucson’s house price appreciation was greater than the U.S. increase of 6.2%, but nearly a full percentage point lower than the state. Arizona’s increase of 7.4% ranked it 10th among all U.S. states. Homes in Tucson have appreciated by 39.1% since 2011 and by 144.8% since 1991. Figure 1 illustrates house price appreciation for the Tucson MSA, Arizona, and the U.S. between 2015 and 2016.
Figure 1: House Price Appreciation
(Growth from the fourth quarter of 2015 to the fourth quarter of 2016)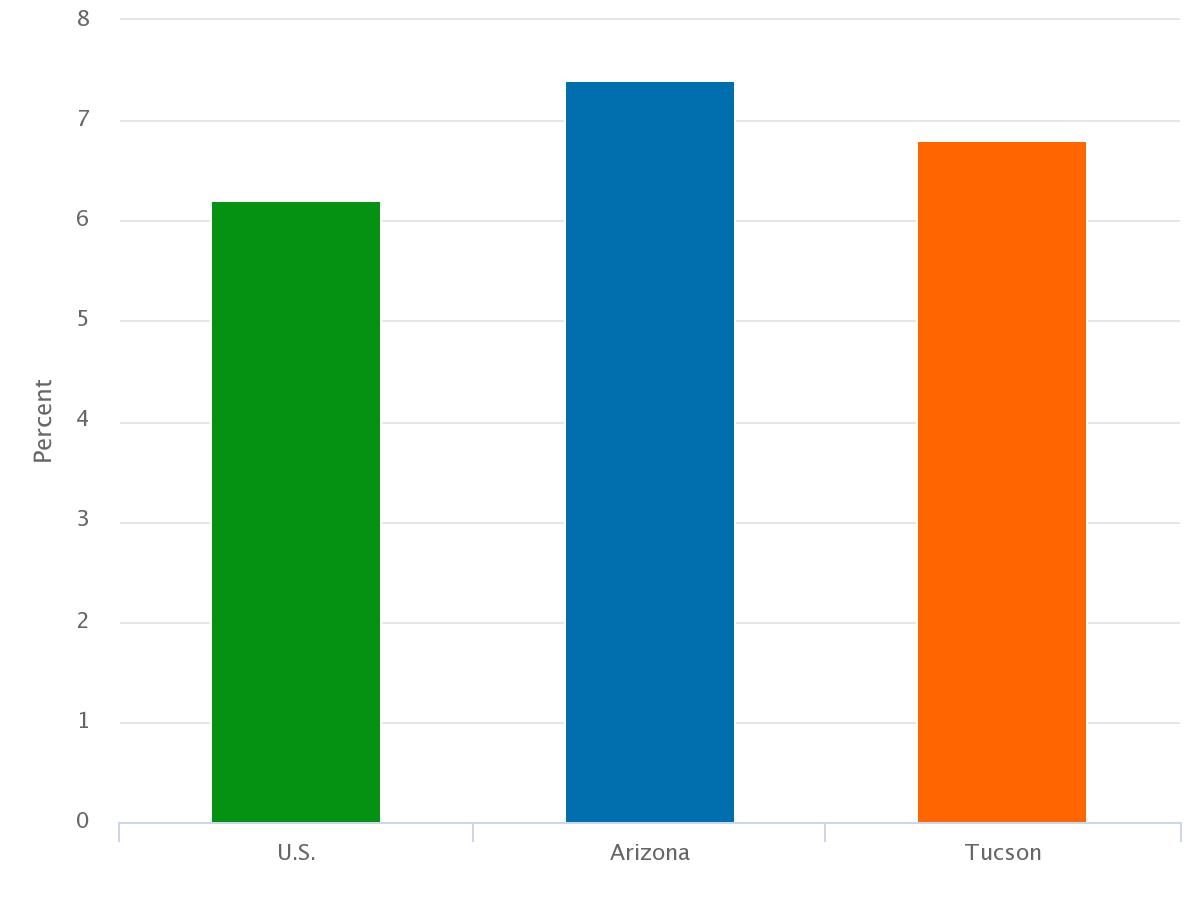
The home is typically the largest asset for most people. Increasing home prices can have positive economic benefits for homeowners because they help to build equity. This improves the household’s financial position and can make it easier to move if desired. Rising home prices also benefit state and local governments who use property taxes to fund many of the services they provide. However, as prices of homes appreciate in expensive housing markets such as San Diego, Denver, and Portland some buyers may find these locations less desirable, therefore boosting migration to more affordable regions like Tucson. According to the MAP Dashboard indicator, Median Home Price, the median price of a home in Tucson was $182,900 in 2015 significantly lower than prices found in many comparable western MSAs.
Tucson ranked 10th among comparable western MSAs in house price appreciation between the fourth quarter of 2015 and the fourth quarter of 2016. Tucson’s growth of 6.8% beat the nation by half a percentage point. Colorado Springs posted the highest house appreciation rate of 11.7% followed closely by Portland at 11.2%. Albuquerque and El Paso had appreciation rates significantly below the U.S. at 4.2% and 1.3% respectively. See Figure 2 to explore the one-year house appreciation rates for select western MSAs.
Figure 2: House Price Appreciation for Select Western MSAs
(Growth from the fourth quarter of 2015 to the fourth quarter of 2016)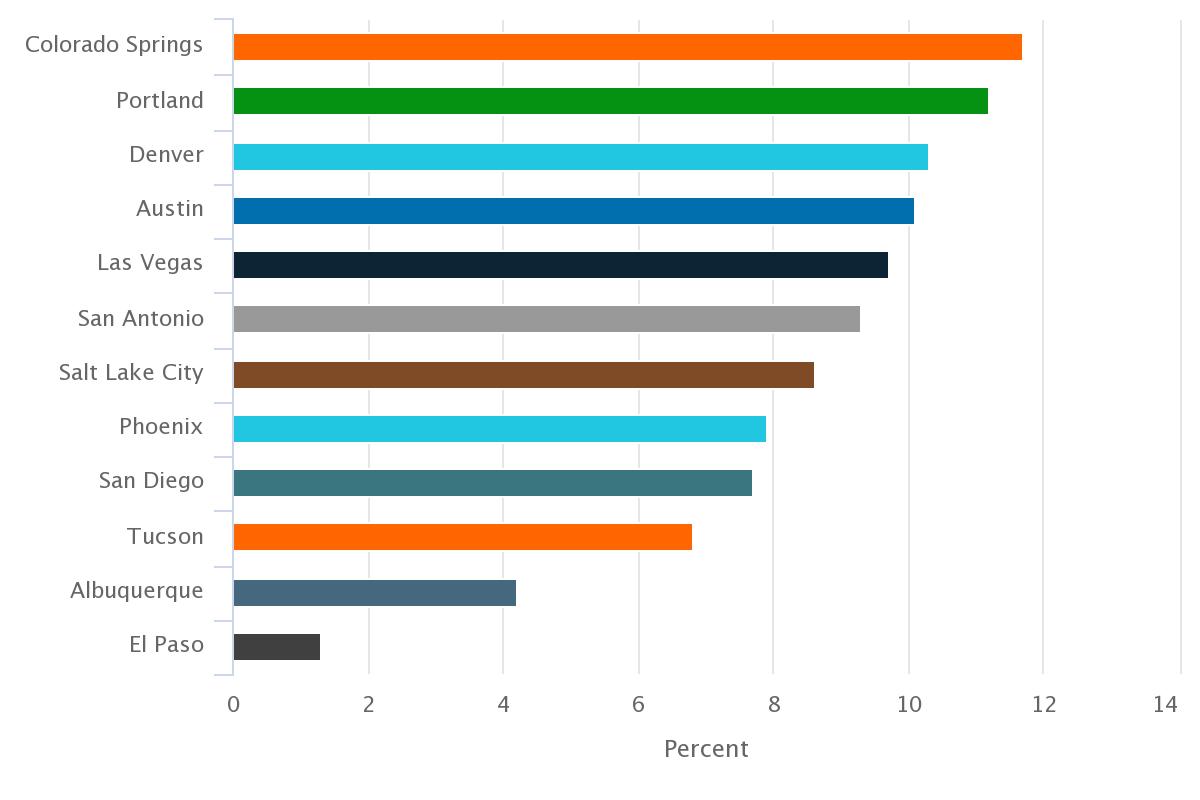
Arizona’s house price appreciation rose at a rate of 7.4% over the year in the 4th quarter of 2016. This ranked Arizona 10th in the nation and eighth among the western states. Oregon posted the strongest appreciation rate in the nation at 11.0% followed by Colorado at 10.6%. Of the 10 western states highlighted on the MAP Dashboard eight of them placed in the top 10 among all U.S. states in house price appreciation and nine surpassed the U.S. rate of 6.2%. Only New Mexico at 4.6% had an appreciation rate lower than the U.S. Figure 3 shows the one-year house appreciation rates for the 10 western states.
Figure 3: House Price Appreciation for Western States
(Growth from the fourth quarter of 2015 to the fourth quarter of 2016)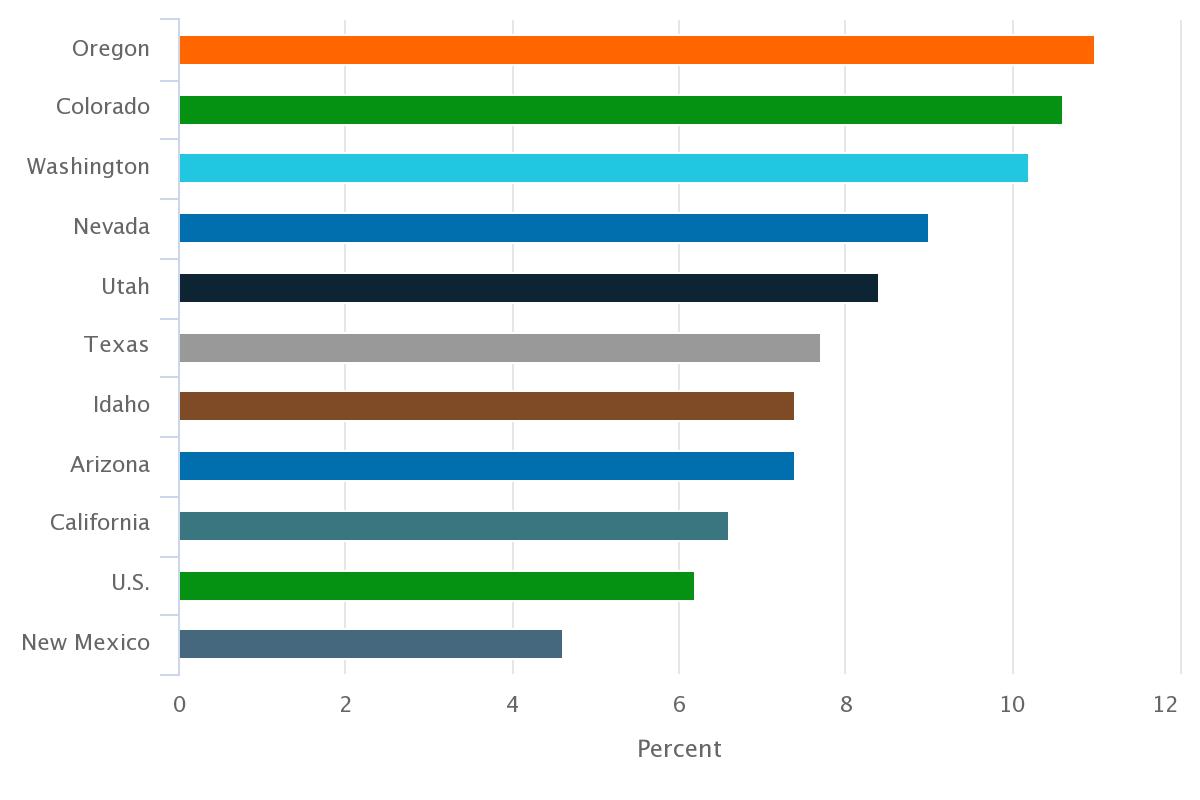
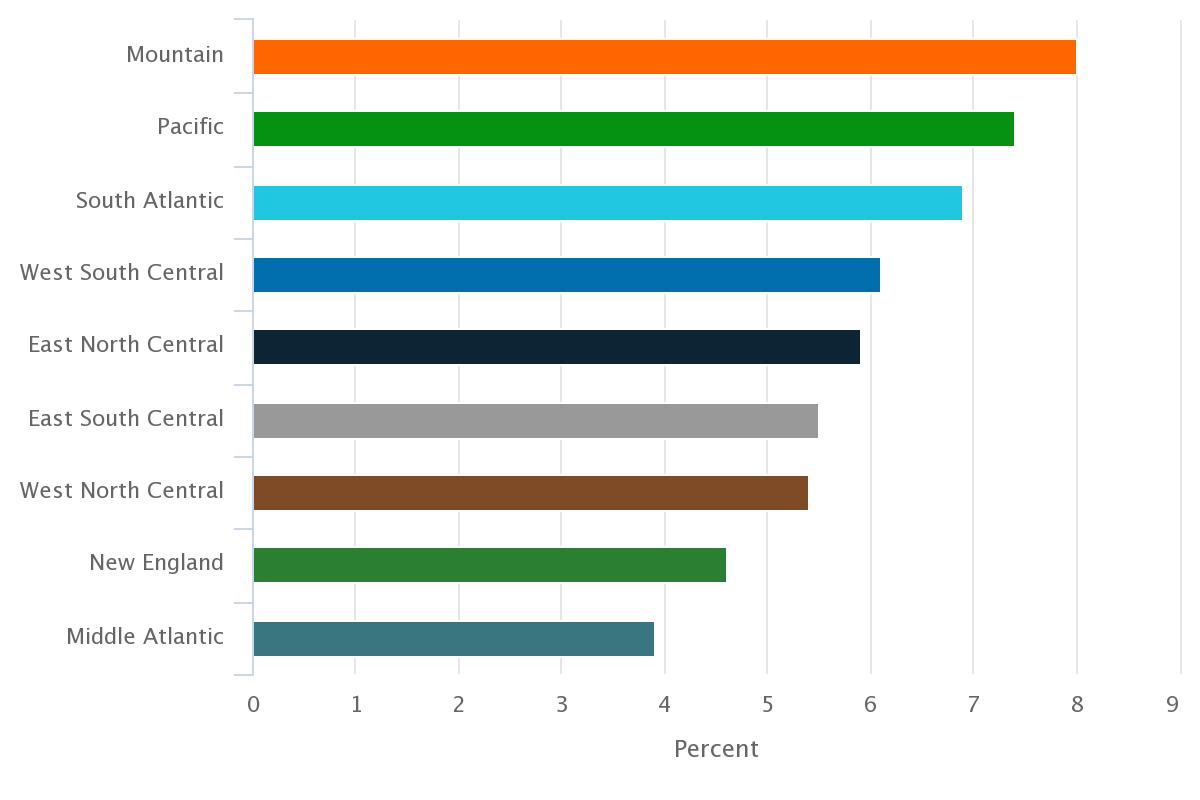
The western U.S. reported strong growth in home prices between the fourth quarter of 2015 and the fourth quarter of 2016 relative to the rest of the nation. The western U.S. is broken-up into two census divisions, Pacific and Mountain. Nearly all of the MSAs explored on the MAP Dashboard fall into these two census divisions, excluding those in Texas. MSAs located in Texas are part of the West South Central census division. The Mountain census division reported the strongest house price appreciation at 8.0%, followed by the Pacific at 7.4%. The Middle Atlantic census division reported the slowest growth at 3.9%. Figure 4 highlights house price appreciation for the census divisions between 2015 and 2016.
Figure 4: House Price Appreciation for Census Divisions
(Growth from the fourth quarter of 2015 to the fourth quarter of 2016)